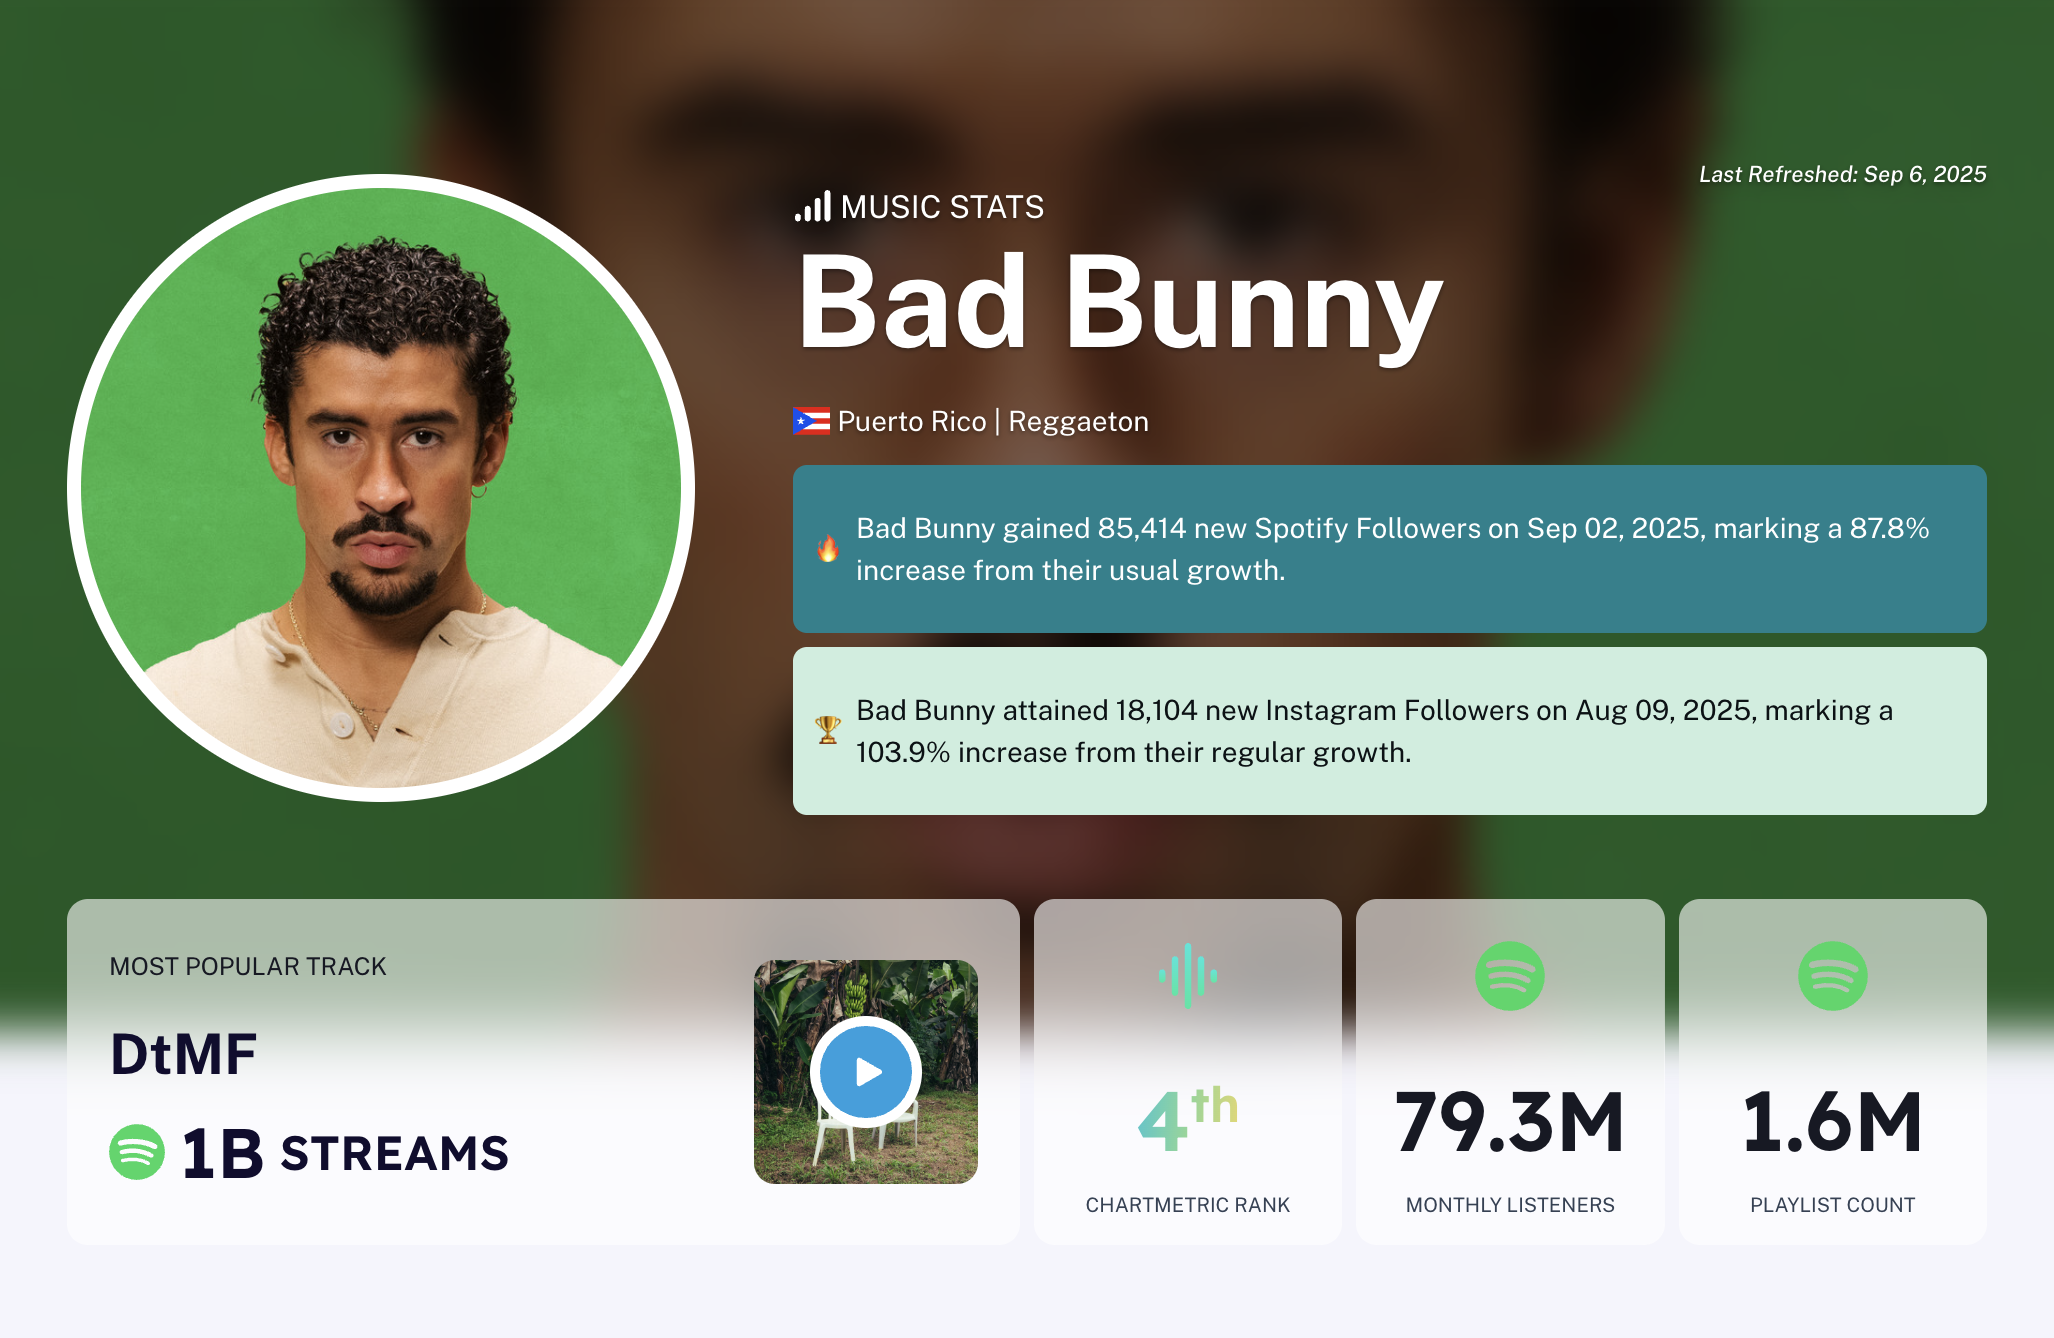
Chartmetric is a suit of music analytics and intelligence tools for labels, artists, managers, and more. The platforms’ insights on streaming and social media data allow users to understand artist and industry trends. Chartmetric provides a free summary dashboard for Bad Bunny, which identifies his main markets as Mexico and the United States and highlights his most popular track, DtMF, at 1B streams. Chartmetric also uniquely provides social media growth metrics. For example, Bad Bunny gained 18,104 Instagram Followers on August 9th, which was a 103.9% increase compared to his usual growth. This might be useful to social media managers who want to understand and replicate his viral success, as they can use this as a starting point to analyze his content leading up to and on that date.
Data on Bad Bunny's Global Popularity
This webpage is designed to provide resources for researching Bad Bunny's global popularity through quantitative data and statistics
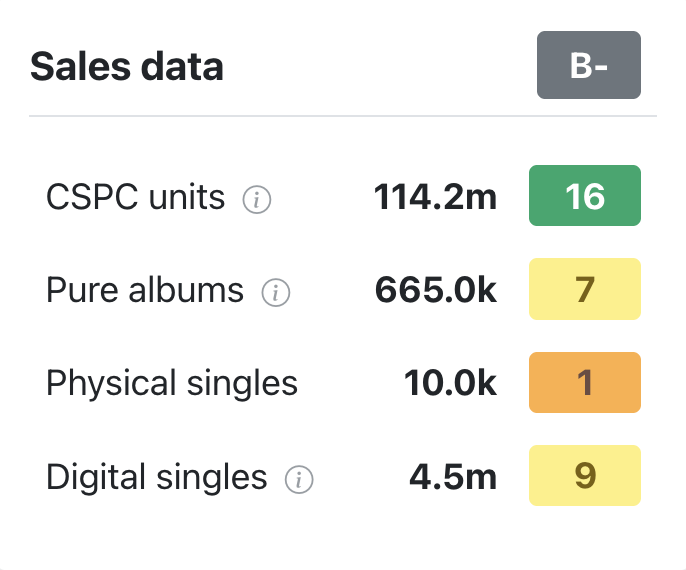
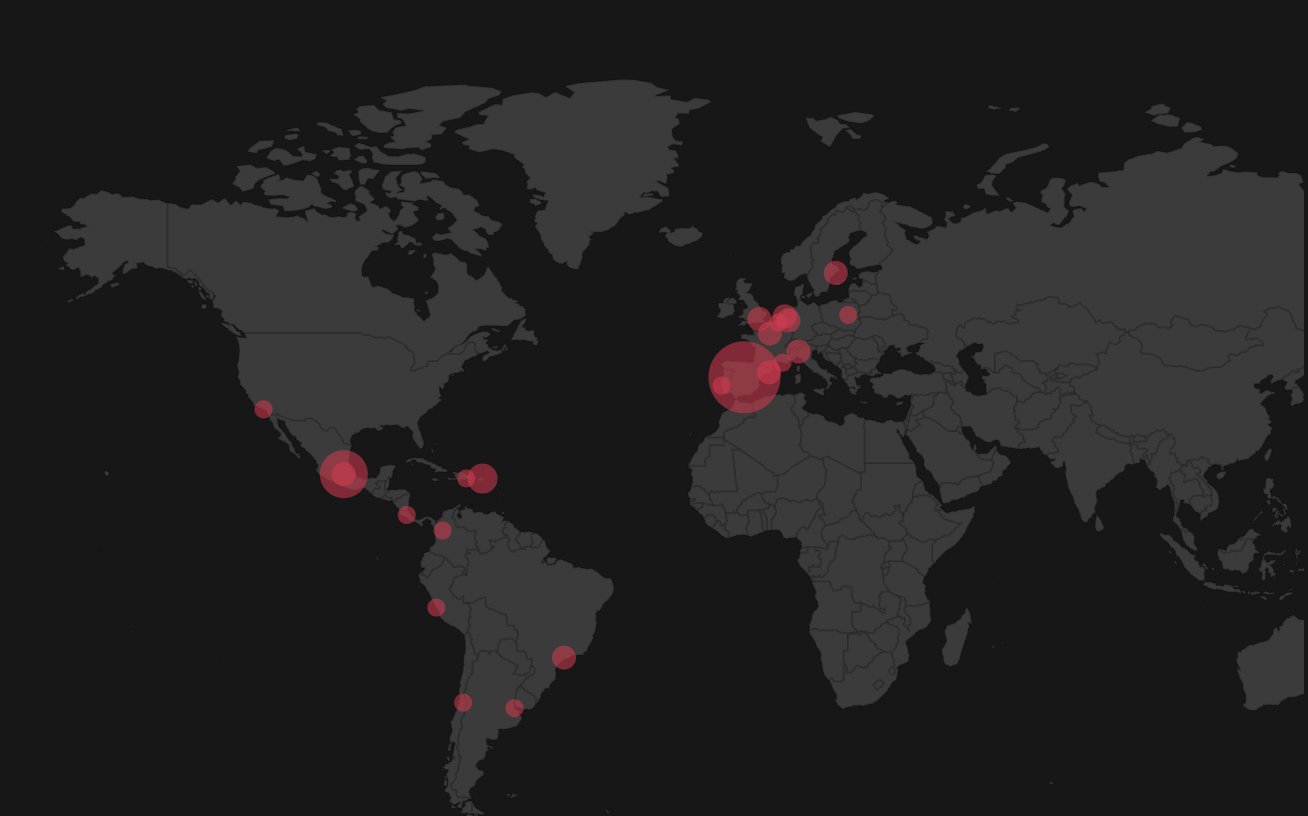
Chartmasters collects and publishes raw data on artists’ record sales and
streaming numbers. In additional to providing basic information on the
artists’ birth date, country, genres, and active status, Chartmasters displays
stats in four main categories: On-demand audio streams, Sales data,
Spotify statistics, and Trends and Indicators. Chartmasters is
particularly valuable as it is the only one out of the three resources
that provides direct sales data for Bad Bunny, which is important for
informing business and finance decisions.

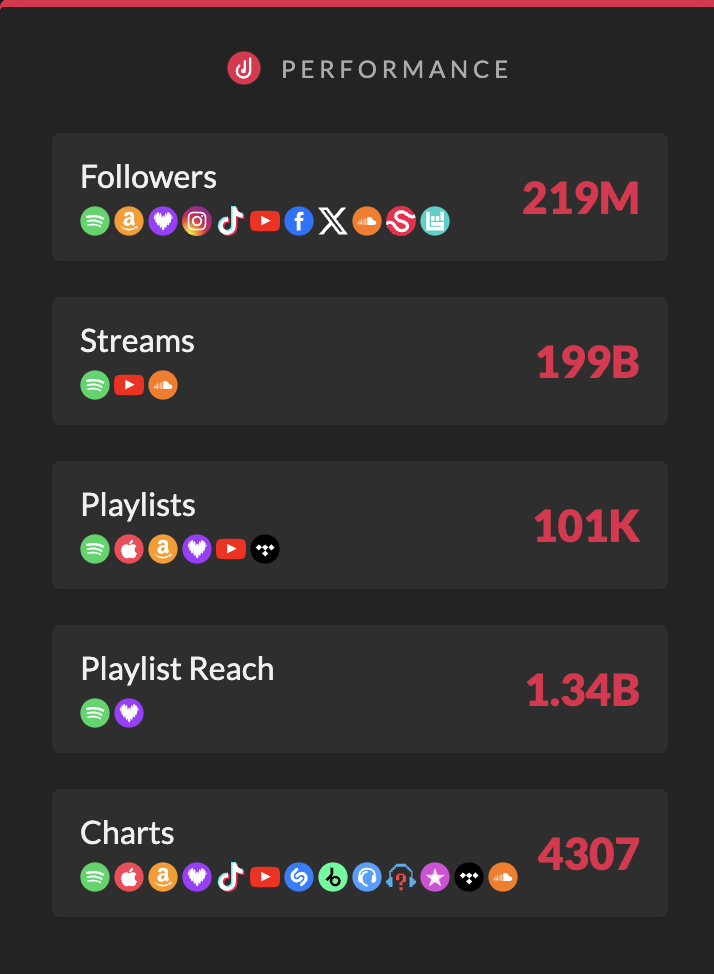
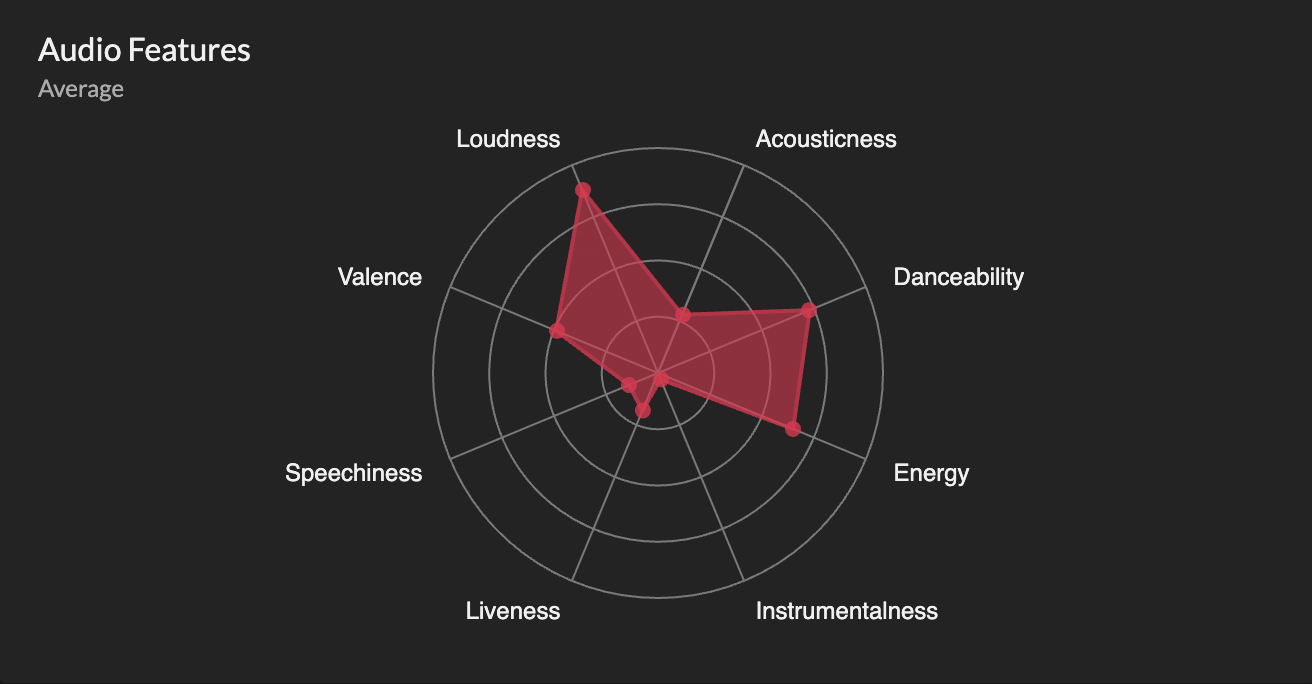
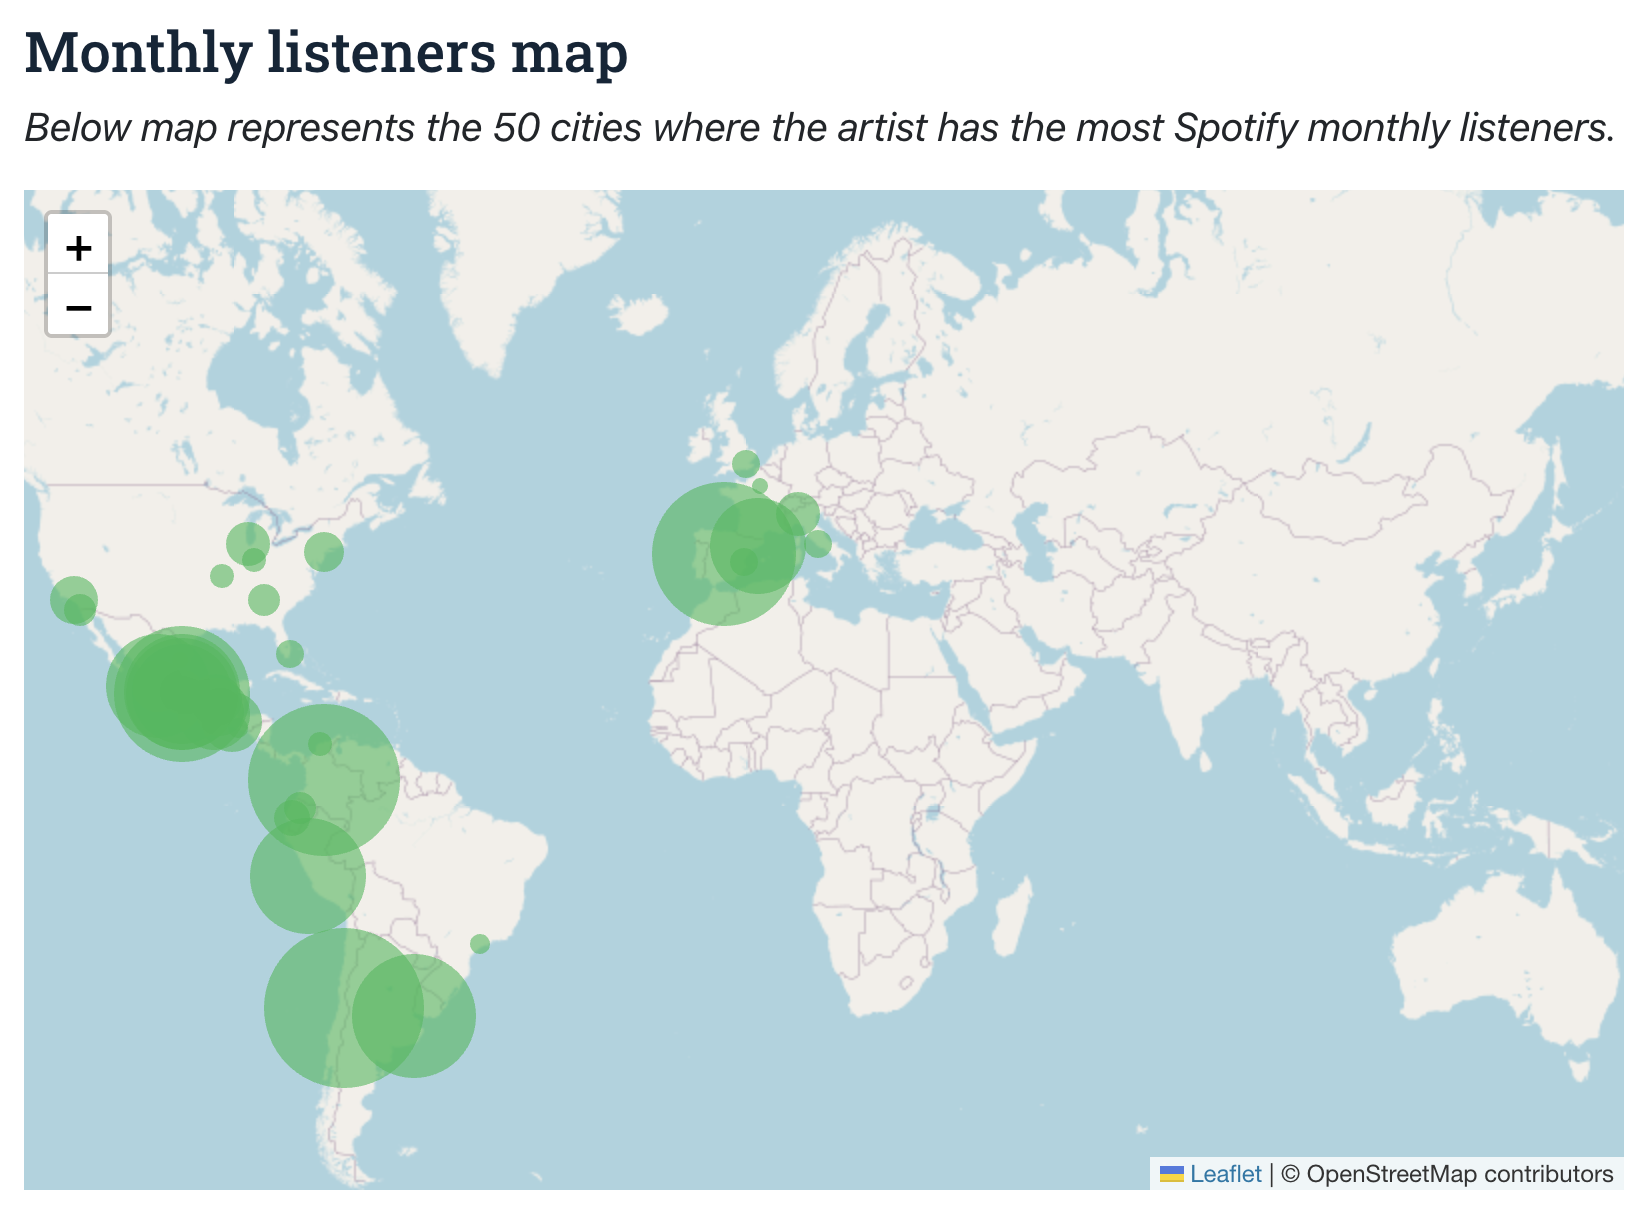
Songstats publishes an activity feed, audience data, and analytics for artists. The activity feed provides daily updates on charts and song features, such as Bad Bunny’s song NUEVAYoL charting 109th in Türkiye, and his song DtMF used in a TikTok by a creator with 2.55M followers on August 9th. One unique element of Songstats is that it provides an Audio Features spider chart (Figure 3) that shows the average rating of Bad Bunny’s music features. The user could utilize this tool to compare artists, which could be useful in applications like an algorithm that recommends similar music. The analytics tab is also helpful as it provides summary statistics for all social media and music streaming platforms combined (Figure 4), which results in a fuller image of Bad Bunny’s global popularity.

Summary
Users may use Chartmetric, Chartmasters, and Songstats in to research Bad Bunny’s global success on social media and streaming platforms. Chartmetric offers helpful growth metrics, Chartmasters provides sales data, and Songstats contains interesting feature data and summary statistics. Users should use all three of these resources in combination to generate new findings. For example, by cross-referencing the global streaming data from Chartmasters and the social media stats from Songstats, users can synthesize findings about the relationship between social media popularity and actual streams. Additionally, users could cross-examine the event map in Songstats, the global streaming map in Chartmasters, and the the primary markets in Chartmetric, to analyze Bad Bunny’s tour dates and uncover the most in-demand and profitable tour stops.